

Incidence of Any Grade Atrial fibrillation/flutter was Significantly Lower with Acalabrutinib1
| Any grade1 | ||
| Acalabrutinib (n=266) | Ibrutinib (n=263) | |
| Atrial fibrillation/flutter | 25 (9.4)a,b | 42 (16.0)b |
| Events/100 person-months | 0.366 | 0.721 |
| Time to onset, median (range), months | 28.8 (0.4-52.0) | 16.0 (0.5-48.3) |
| Leading to treatment discontinuationc | 0 | 7 (16.7) |
| Afib/flutter incidence among patients without prior history of afib/flutter | 15/243 (6.2) | 37/249 (14.9) |
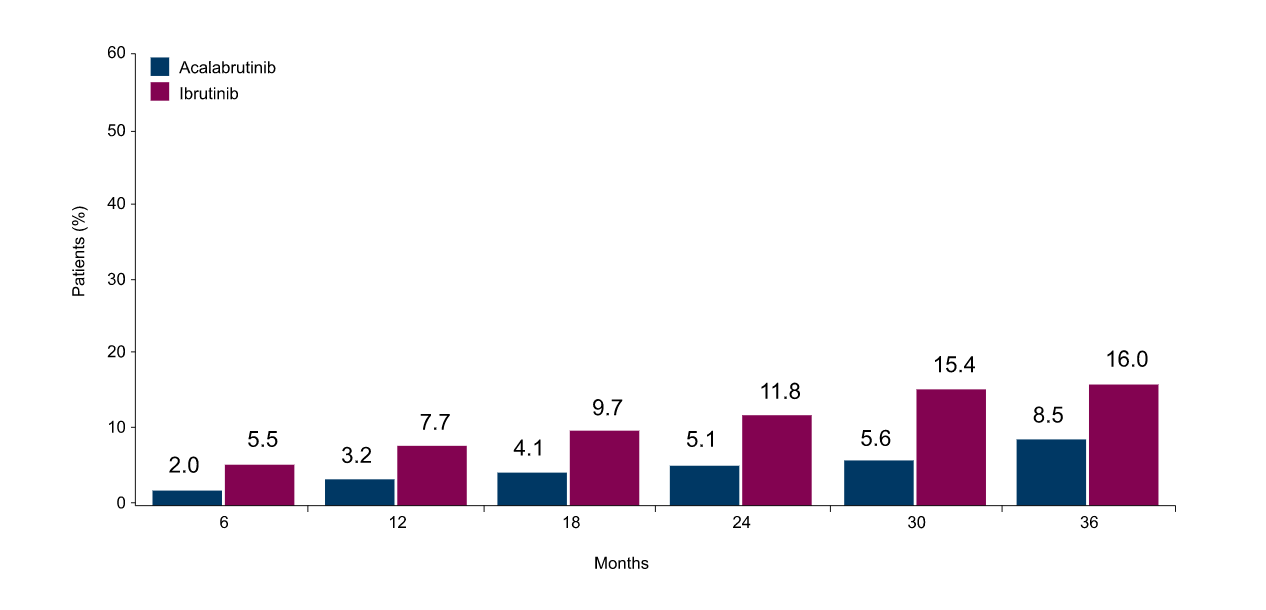
Cumulative Incidence of Any Grade AF was Lower for Acalabrutinib at Each Time Point2
Incidence of Any Grade AF/Flutter2
Incidence of Any Grade AF/Flutter2
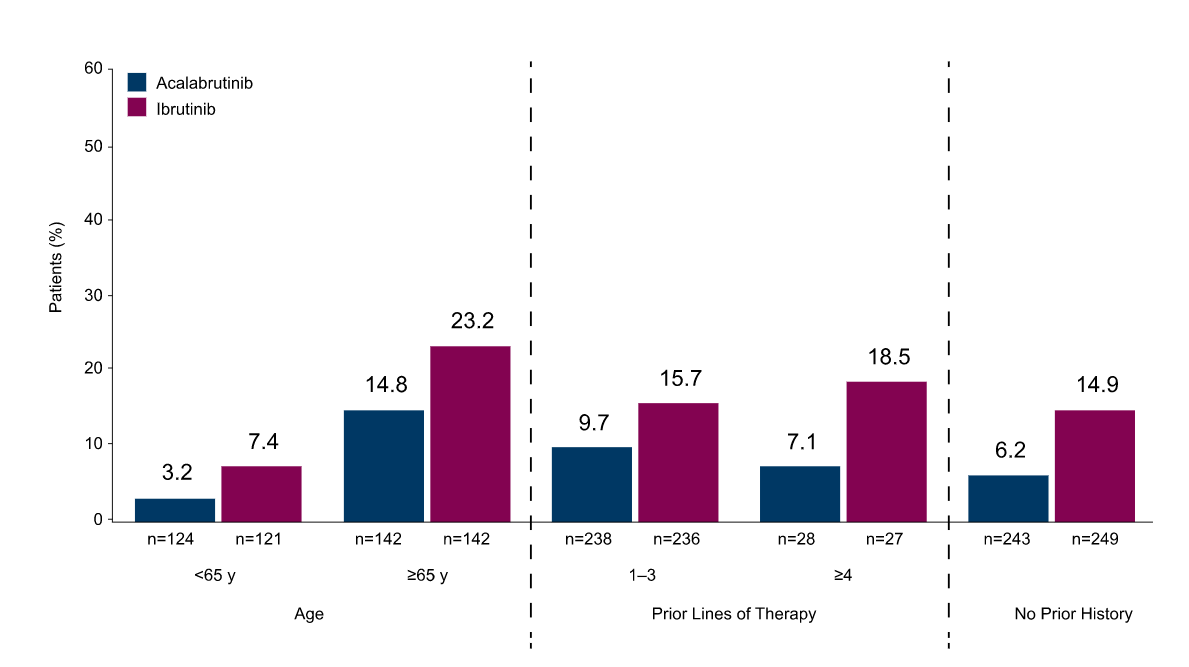
Incidence Bar Graph of AF in Patient Subgroups2
Incidence of AF/Flutter in Patient subgroups2
Incidence of AF/Flutter in Patient subgroups2
Hypertension and Selected Cardiac Events3
| Acalabrutinib (n=266) | Ibrutinib (n=263) | |||
| Events | Any grade | Grade ≥3 | Any Grade | Grade ≥3 |
| Hypertension eventsa | 25 (9.4) | 11 (4.1) | 61 (23.2) | 24 (9.1) |
| 0.444 | 0.133 | 1.243 | 0.435 |
| 16/25 (64.0) | 9/11 (81.8) | 30/61 (49.2) | 16/24 (66.7) |
| Any cardiac event | 64 (24.1) | 23 (8.6) | 79 (30.0) | 25 (9.5) |
| 1 (0.4) | 1 (0.4) | 5 (1.9) | 3 (1.1) |
| 1 (0.4) | 1 (0.4) | 0 | 0 |
| 0 | 0 | 2 (0.8) | 2 (0.8) |
| 0 | 0 | 1 (0.4) | 0 |
| 0 | 0 | 1 (0.4) | 0 |
| 0 | 0 | 1 (0.4) | 1 (0.4) |
Note: Data are n (%) unless otherwise specified.
aIncludes events with the preferred terms of hypertension, blood pressure increased, and blood pressure systolic increased; two-sided p value on the basis of Barnard’s exact test without multiplicity adjustment, p=0.001 (any grade) and p=0.0214 (grade ≥3).
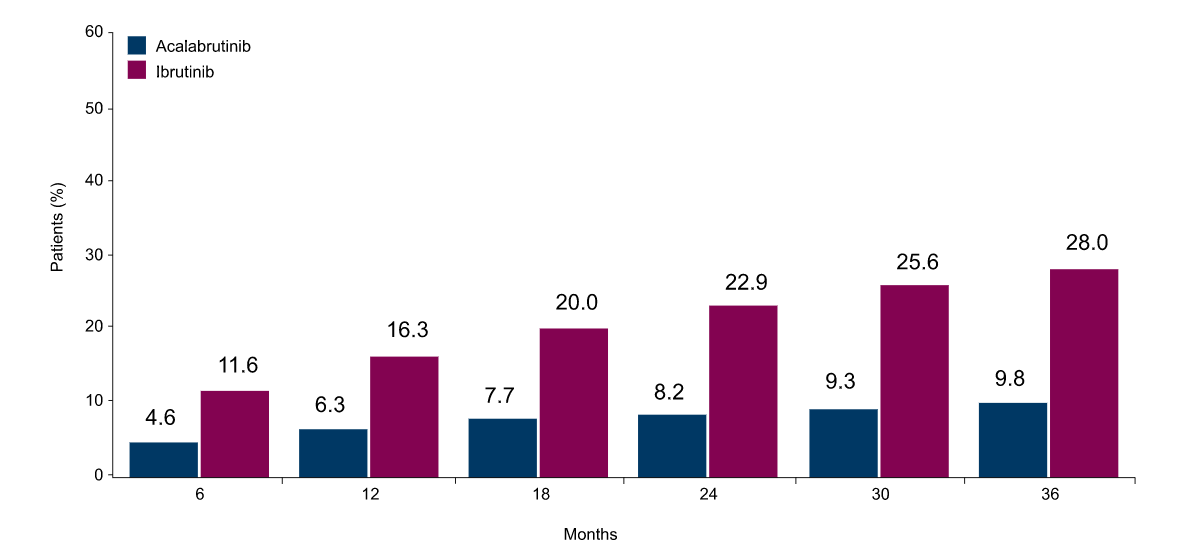
Cumulative Incidence of Any-Grade HTN was Lower with Acalabrutinib at Each Time Point2
Incidence of Any Grade HTN2
Incidence of Any Grade HTN2
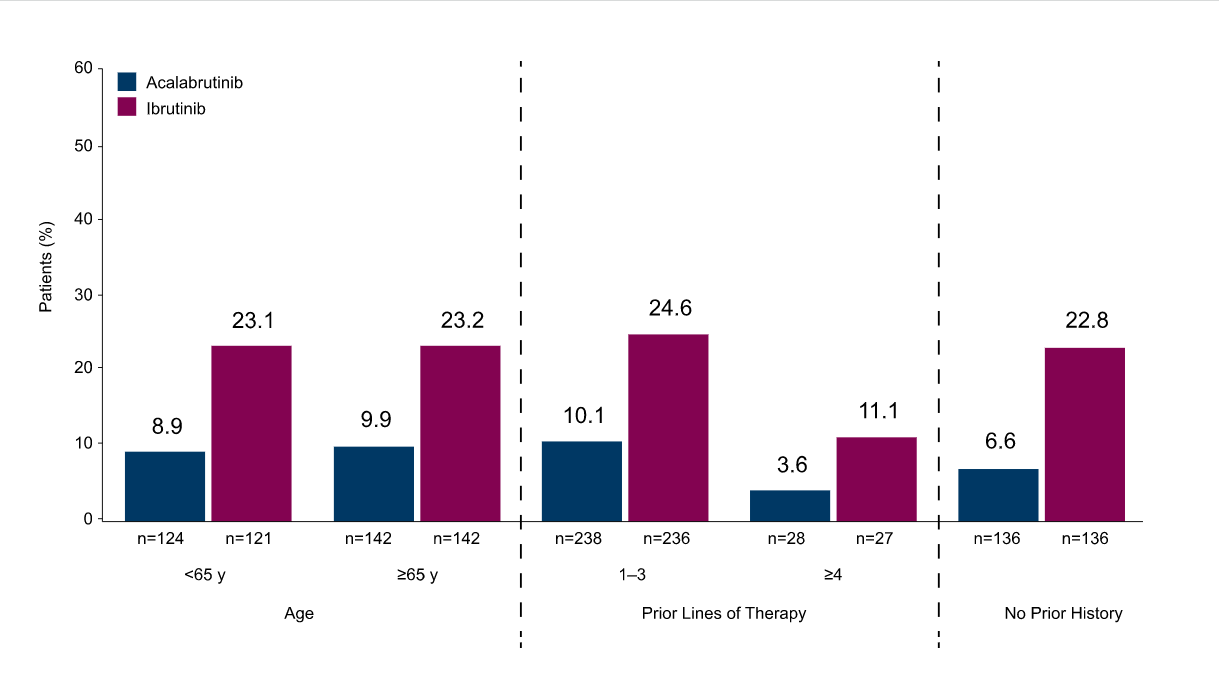
Incidence Bar Graph of HTN in Subgroups2
Incidence of HTN in Patient Subgroups2
Incidence of HTN in Patient Subgroups2
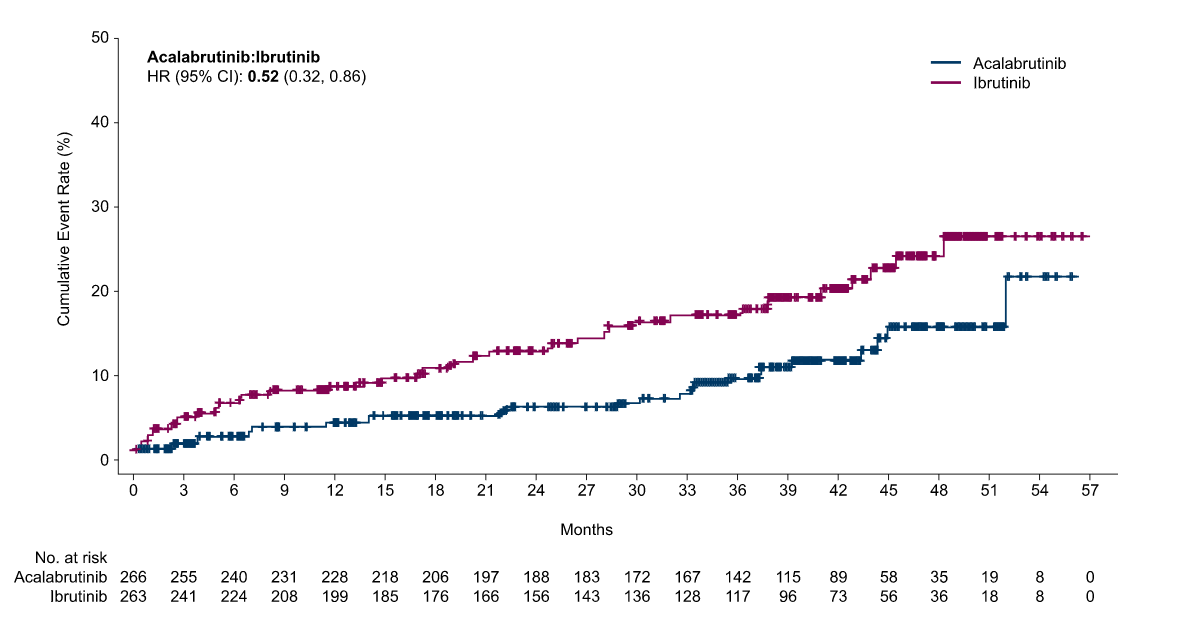
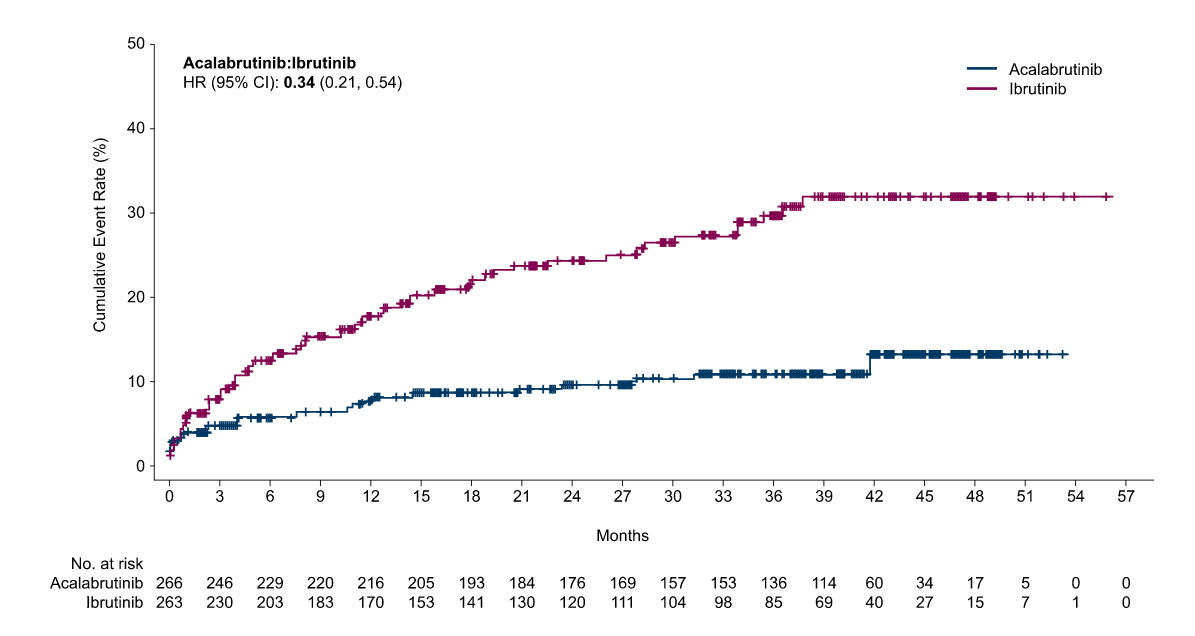
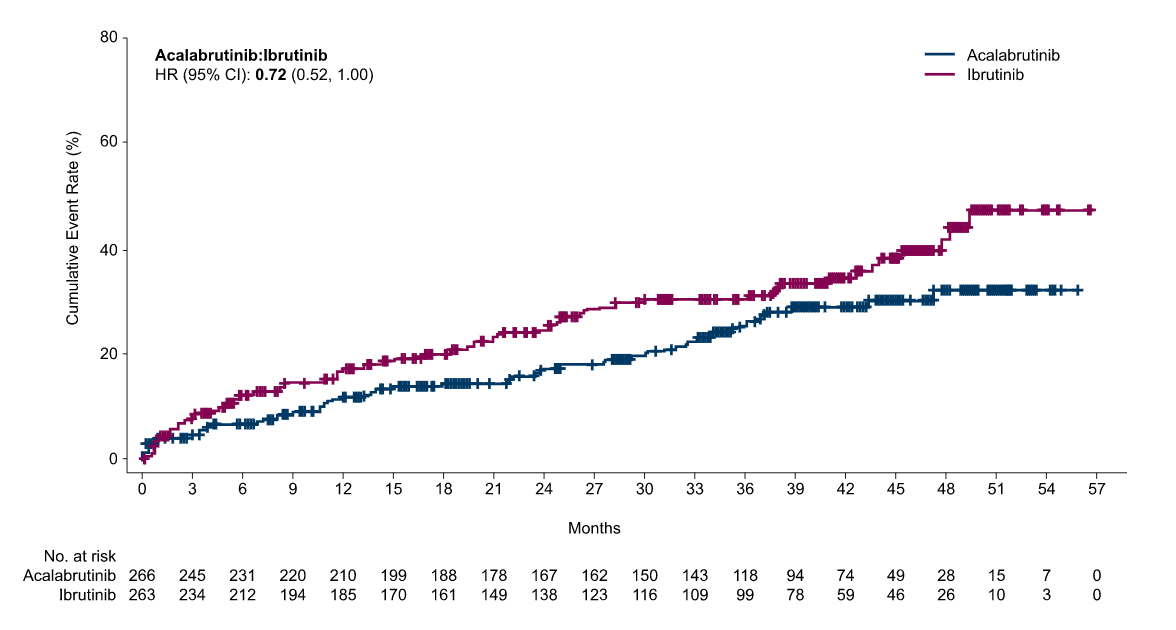
Cumulative Incidence KM Curves for Select AEs3
- Atrial Fib/flutter
- Hypertension
- Cardiac Events
Cumulative incidences of any grade atrial fibrillation/flutter3
Cumulative incidences of any grade hypertension3
Cumulative incidences of any grade cardiac events3
Abbreviations
AF = atrial fibrillation
;Afib/flutter = atrial fibrillation/flutter
;CI = confidence interval
;HR = hazard ratio
;HTN = hypertension
;No. = number
References
2. Seymour JF, Byrd JC, Hillmen P, et al. Characterization of Bruton tyrosine kinase inhibitor (BTKi)-related adverse events in a head-to-head trial of acalabrutinib versus ibrutinib in previously treated chronic lymphocytic leukemia (CLL) [poster]. Presented at American Society of Hematology (ASH) Annual Meeting; December 11-14, 2021; Atlanta, Georgia. Abs. 3721.
3. Byrd JC, Hillmen P, Ghia P, et al. Acalabrutinib versus ibrutinib in previously treated chronic lymphocytic leukemia: Results of the first randomized Phase III trial. J. Clin. Oncol. 2021. https://doi.org/10.1200/JCO.21.01210.
Document ID: b5f1a3c0-28eb-4186-8709-e3ddba7b6695
Last updated: 17-April-2023