



DESTINY-Breast01: Biomarker Analysis (August 1, 2019 DCO Date)
Biomarker Analysis1
- Here we examine data from patients in DESTINY-Breast01 for molecular variables predictive of patient outcomes1
- Archived tumor tissue samples were collected prior to treatment in order to centrally confirm HER2 status and perform baseline biomarker analyses by RNA sequencing1
- Plasma samples for biomarker analysis, including circulating tumor DNA (ctDNA), were collected prior to treatment on day 1 of cycle 1, then on day 1 every 3 cycles thereafter (ie, cycles 4, 7, and 10), and at the end of treatment1
- GuardantOMNI (Guardant Health) was used for sequencing to detect single-nucleotide variation/ insertion and deletion, amplification (including the HER2 gene ERBB2), and fusion of approximately 500 genes1
- Serum samples for HER2 extracellular domain (HER2 ECD) assessment were collected before dosing on day 1 of cycle 3 and every other cycle thereafter (ie, cycles 5, 7, and 9) as well as at the end of treatment1
Baseline Biomarkers1
Baseline Biomarkers: ctDNA
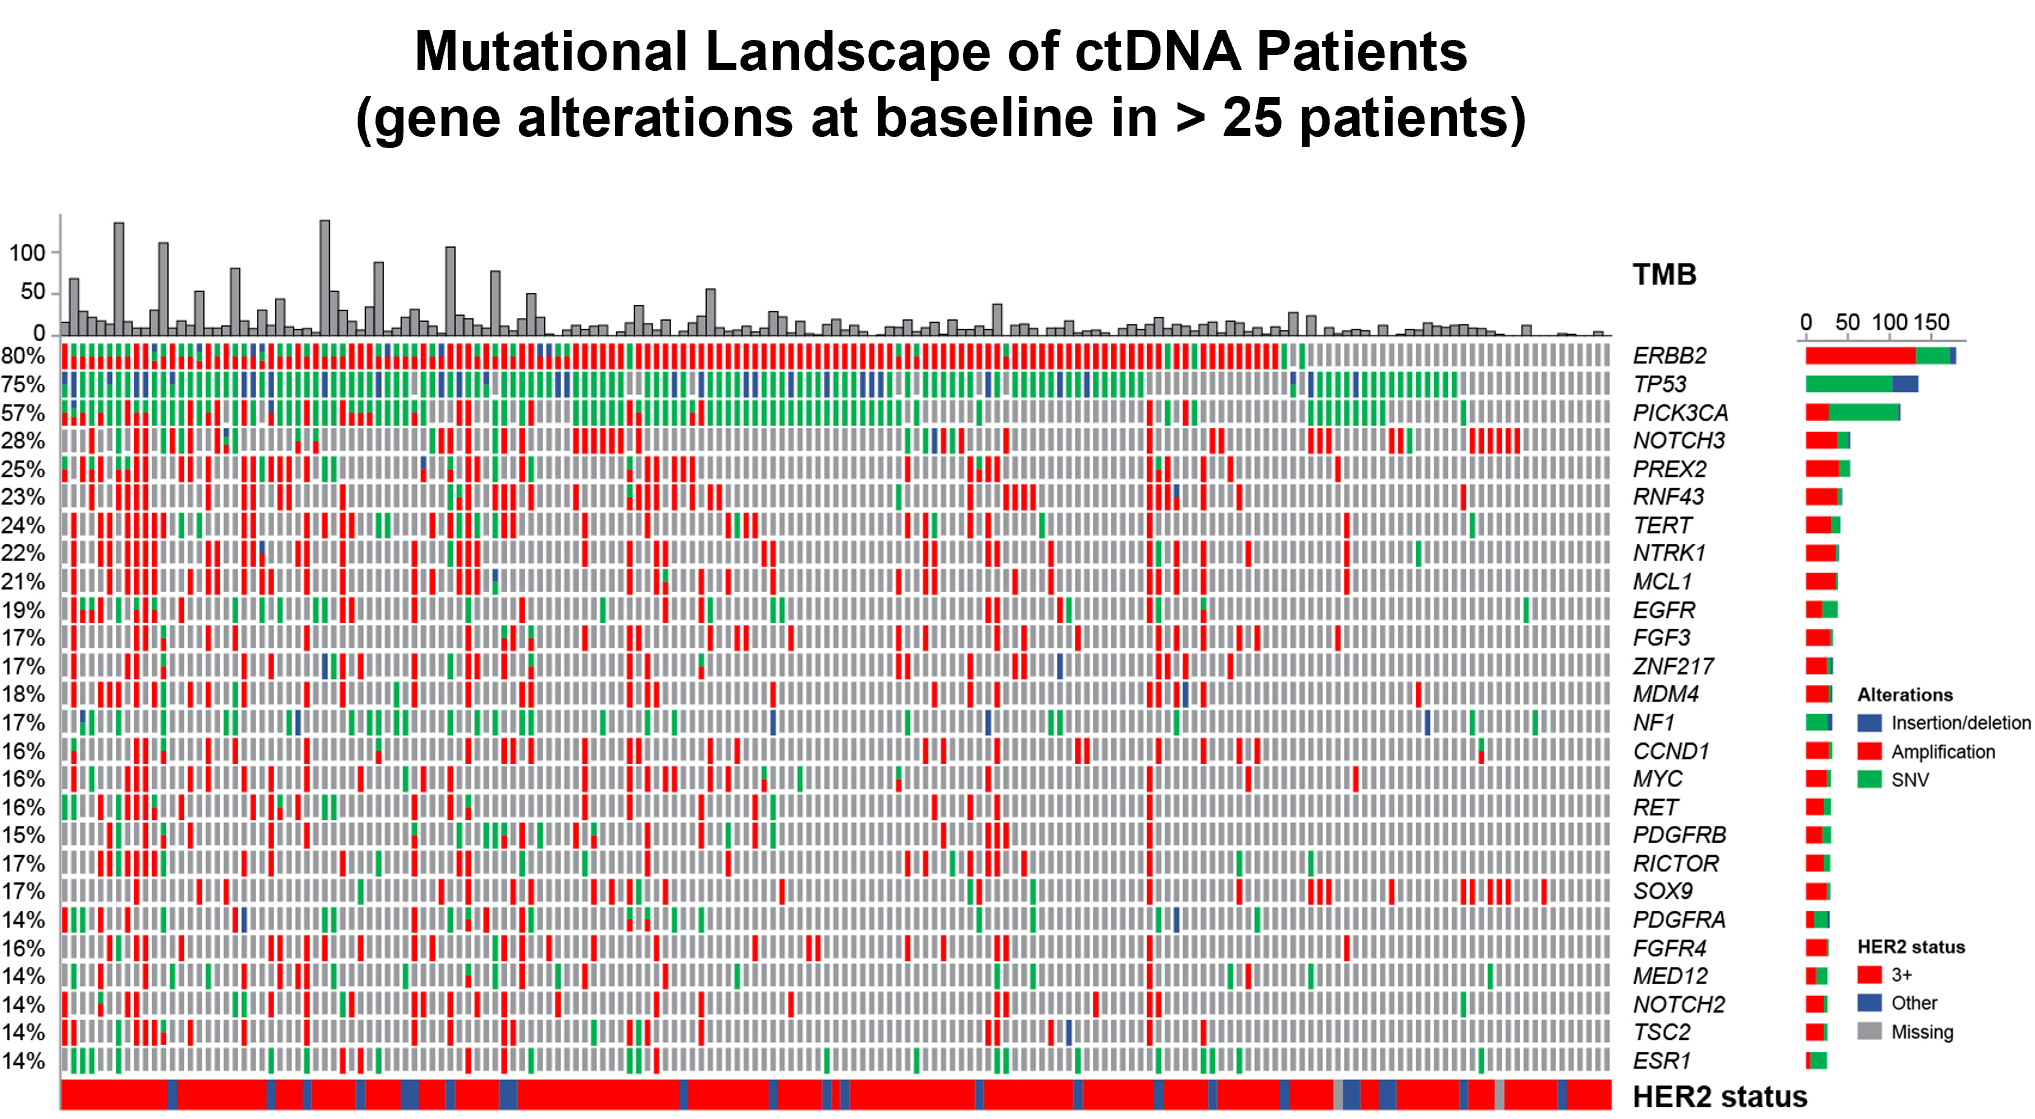
- Blood samples were collected at cycle 1, day 1; passed quality control for ctDNA analysis; and showed detectable ctDNA in 97.7% of patients (171/175). Somatic mutations in the GuardantOMNI report were used1
- ERBB2 amplification and gain-of-function mutations were observed in 77% (133/173) and 12% (21/173) of samples, respectively1
- High-prevalence somatic mutations included TP53 (75% [130/173]), PIK3CA (57% [98/173]), and NOTCH3 (28% [49/173])1
Mutational Landscape of ctDNA Patients.1
Mutational Landscape of ctDNA Patients.1
Baseline Biomarkers: ERBB2 and HER2 ECD
Neither baseline-adjusted ERBB2 plasma copy number (pCN)1 in ctDNA nor HER2 ECD levels in patients’ sera were predictive of ORR or PFS (ERBB2, p=0.202; HER2 ECD, p=0.352)1
Baseline-Adjusted ERBB2 Plasma Copy Number (A)a and HER2 ECD Levels (B) vs Response Rate.1
Baseline-Adjusted ERBB2 Plasma Copy Number (A)a and HER2 ECD Levels (B) vs Response Rate.1
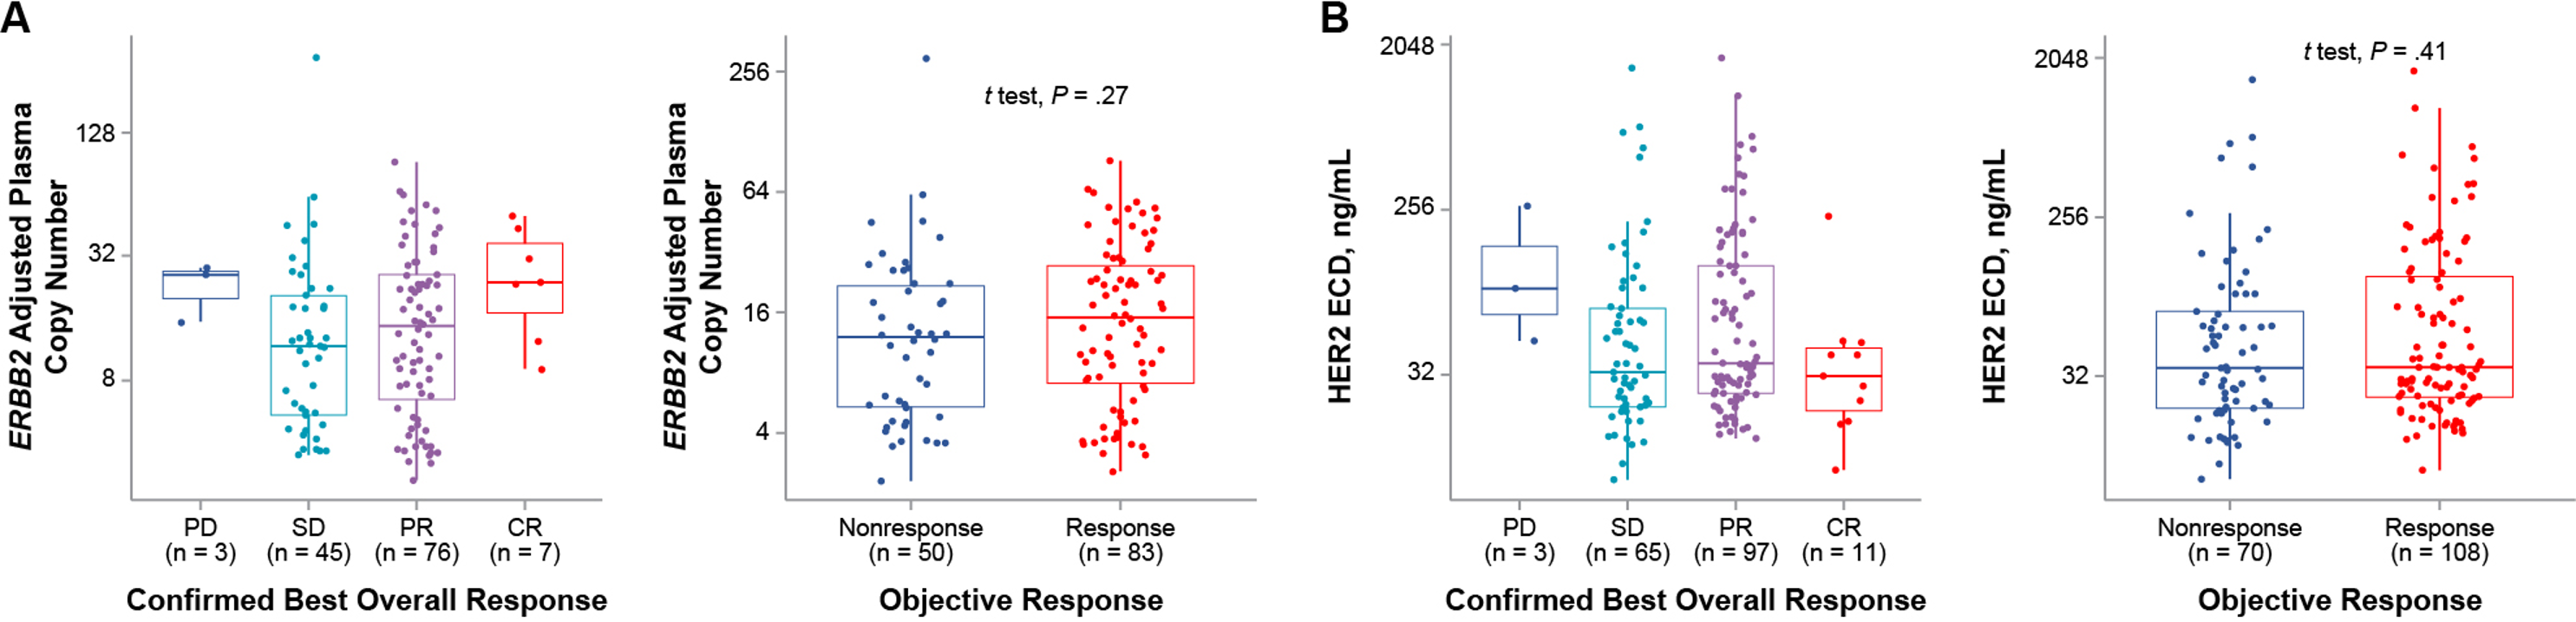
aOnly patients with ERBB2 amplification are included.
| Covariate | Patients, n | PFS | |
| HR (95% CI) | p Value | ||
| ERBB2 apCN, log2 | 133 | 0.85 (0.67-1.09) | 0.202 |
| HER2 ECD, log2 | 178 | 1.08 (0.92-1.26) | 0.352 |
Baseline Biomarkers: Gene Alterations
Several somatic alterations in single genes were correlated with PFS and ORR1
| Covariate | Type | Status | Patients, n | Median (95% CI) | HR (95% CI) | p Value | FDR | Response (CR/PR), n (%) | Odds Ratio (95% CI) | p Value | FDR |
PFSa | ORRb | ||||||||||
MSH2 | SNV | WT | 164 | 17.6 (12.7-NE) | 4.05 | .00134 | 0.161 | 101 (61.6) | 3.18 | 0.158 | 1 |
| indel | mut | 9 | 5.2 (4.1-NE) | (1.72-9.54) | 3 (33.3) | (0.71-15.18) | |||||
GATA3 | SNV | WT | 156 | 17.6 (17.6-NE) | 2.76 | .00414 | 0.167 | 96 (61.5) | 1.79 | 0.3 | 1 |
| indel | mut | 17 | 8.1 (5.7-NE) | (1.38-5.51) | 8 (47.1) | (0.63-4.96) | |||||
AXL | CNV | WT | 160 | 17.6 (12.7-NE) | 3.15 |
.00483 | 0.167 | 97 (60.6) | 1.32 | .77 | 1 |
| amp | 3 | 6.7 (4.1-NE) | (1.42-7.01) | 7 (53.8) | (0.41-4.32) | ||||||
RET | CNV | WT | 148 | 17.6 (12.7-NE) | 2.53 | .0063 | 0.167 | 89 (58.6) | 0.57 | .343 | 1 |
| amp | 25 | 6.7 (4.3-NE) | (1.3-4.94) | 15 (71.4) | (0.21-1.59) | ||||||
ZNF217 | CNV | WT | 148 | 17.6 (12.7-NE) | 2.37 | .00695 | 0.167 | 92 (62.2) | 1.77 | 193 | 1 |
| amp | 25 | 6.7 (4.3-NE) | (1.27-4.43) | 12 (48) | (0.74-4.4) | ||||||
DEPDC5 | SNV | WT | 158 | 17.6 (17.6-NE) | 2.48 | .019 | 0.355 | 94 (59.5) | 0.74 | .784 | 1 |
| indel | mut | 15 | 7.1 (5.7-NE) | (1.16-5.3) | 10 (66.7) | (0.23-2.43) | |||||
ROBO1 | SNV | WT | 164 | 17.6 (12.7-NE) | 2.98 | .0207 | 0.355 | 101 (61.6) | 3.18 | .158 | 1 |
| indel | mut | 9 | 5.7 (3-NE) | (1.18-7.5) | 3 (33.3) | (0.71-15.18) | |||||
TSC2 | CNV | WT | 152 | 17.6 (12.7-NE) | 2.18 | .0271 | 0.406 | 93 (61.2) | 1.43 | .481 | 1 |
| amp | 21 | 7.1 (5.4-NE) | (1.09-4.34) | 11 (52.4) | (0.56-3.61) | ||||||
FGF3 | CNV | WT | 144 | 17.6 (12.7-NE) | 1.95 | .0314 | 0.419 | 88 (61.1) | 1.27 | .678 | 1 |
| amp | 29 | 7.1 (6-NE) | (1.06-3.59) | 16 (55.2) | (0.57-2.99) | ||||||
FGF19 | CNV | WT | 149 | 17.6 (12.7-NE) | 1.99 | .0366 | 0.439 | 91 (61.1) | 1.33 | .654 | 1 |
| amp | 24 | 7.1 (6.2-NE) | (1.04-3.79) | 13 (54.2) | (0.53-3.26) | ||||||
IGF1R | SNV | WT | 161 | 17.6 (12.7-NE) | 2.43 | .0418 | 0.454 | 98 (60.9) | 1.55 | .546 | 1 |
indel | mut | 12 | 6.7 (4.2-NE) | (1.03-5.7) | 6 (50) | (0.46-5.24) | |||||
CARD 11 | SNV | WT | 164 | 17.6 (12.7-NE) | 2.86 | .0454 | 0.454 | 100 (61) | 1.96 | .486 | 1 |
indel | mut | 9 | 6.7 (4.2-NE) | (1.02-8) | 4 (44.4) | (0.5-7.94) | |||||
RUNX1 | CNV | WT | 163 | 17.6 (12.7-NE) | 1.34 | .575 | 0.877 | 94 (57.7) | 0 | .00637 | 0.764 |
| amp | 10 | NE (6.7-NE) | (0.48-3.71) | 10 (100) | (0-0.6) | ||||||
SETD2 | SNV | WT | 164 | 17.6 (12.7-NE) | 1.18 | .778 | 0.929 | 102 (62.2) | 5.7 | .0305 | 1 |
indel | mut | 9 | NE (4.1-NE) | (0.37-3.79) | 2 (22.2) | (1.21-39.18) | |||||
Baseline Biomarkers: Not Associated With Clinical Outcomes
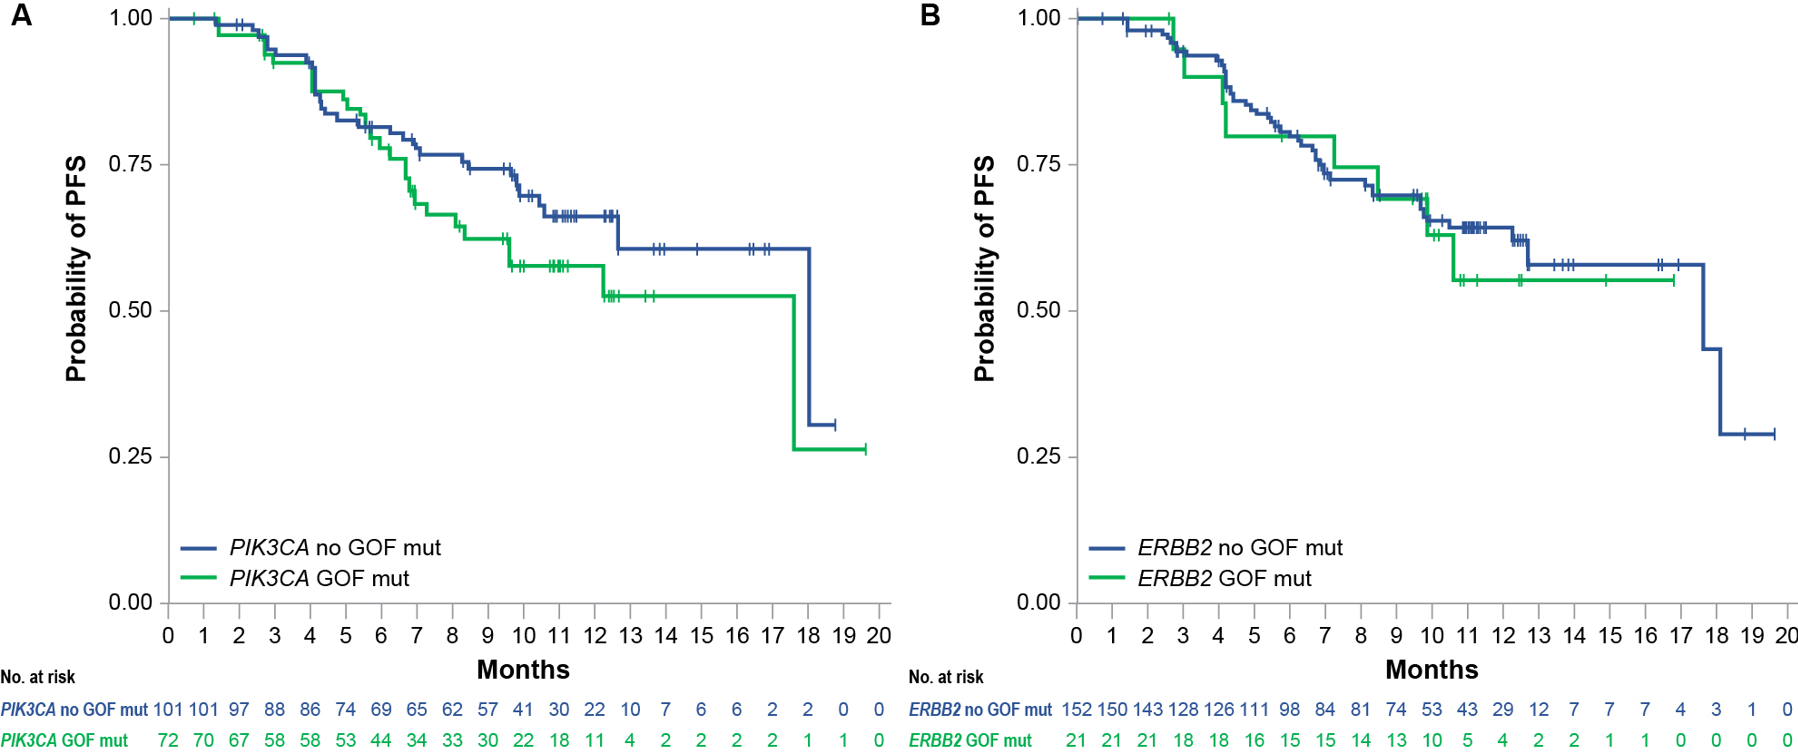
PIK3CA mutations and ERBB2 gain-of-function mutations were not associated with clinical outcomes1
PIK3CA (A) and ERBB2 Gain-of-Function Mutations (B) and PFS.1
PIK3CA (A) and ERBB2 Gain-of-Function Mutations (B) and PFS.1
| Covariate | Type | Status | Patients, n | Median (95% CI) | HR (95% CI) | p Value | Response (CR/PR), n (%) | Odds Ratio (95% CI) | p Value |
PFS | ORR | ||||||||
ERBB2a | SNV | no GOF mut | 152 | 17.6 (12.7-NE) | 1.13 | 0.747 | 89 (58.6) | 0.57 | 0.343 |
Indel (GOF) | mut | 21 | NE (9.9-NE) | (0.53–2.4) | 15 (71.4) | (0.21-1.6) | |||
PIK3CAb | SNV | no GOF mut | 101 | 18.1 (12.7-NE) | 1.4 | 0.215 | 56 (55.4) | 0.62 | 0.158 |
Indel (GOF) | mut | 72 | 17.6 (9.6-NE) | (0.82–2.36) | 48 (66.7) | (0.33–1.2) | |||
Biomarkers Over Time1
Biomarkers Over Time: ERBB21
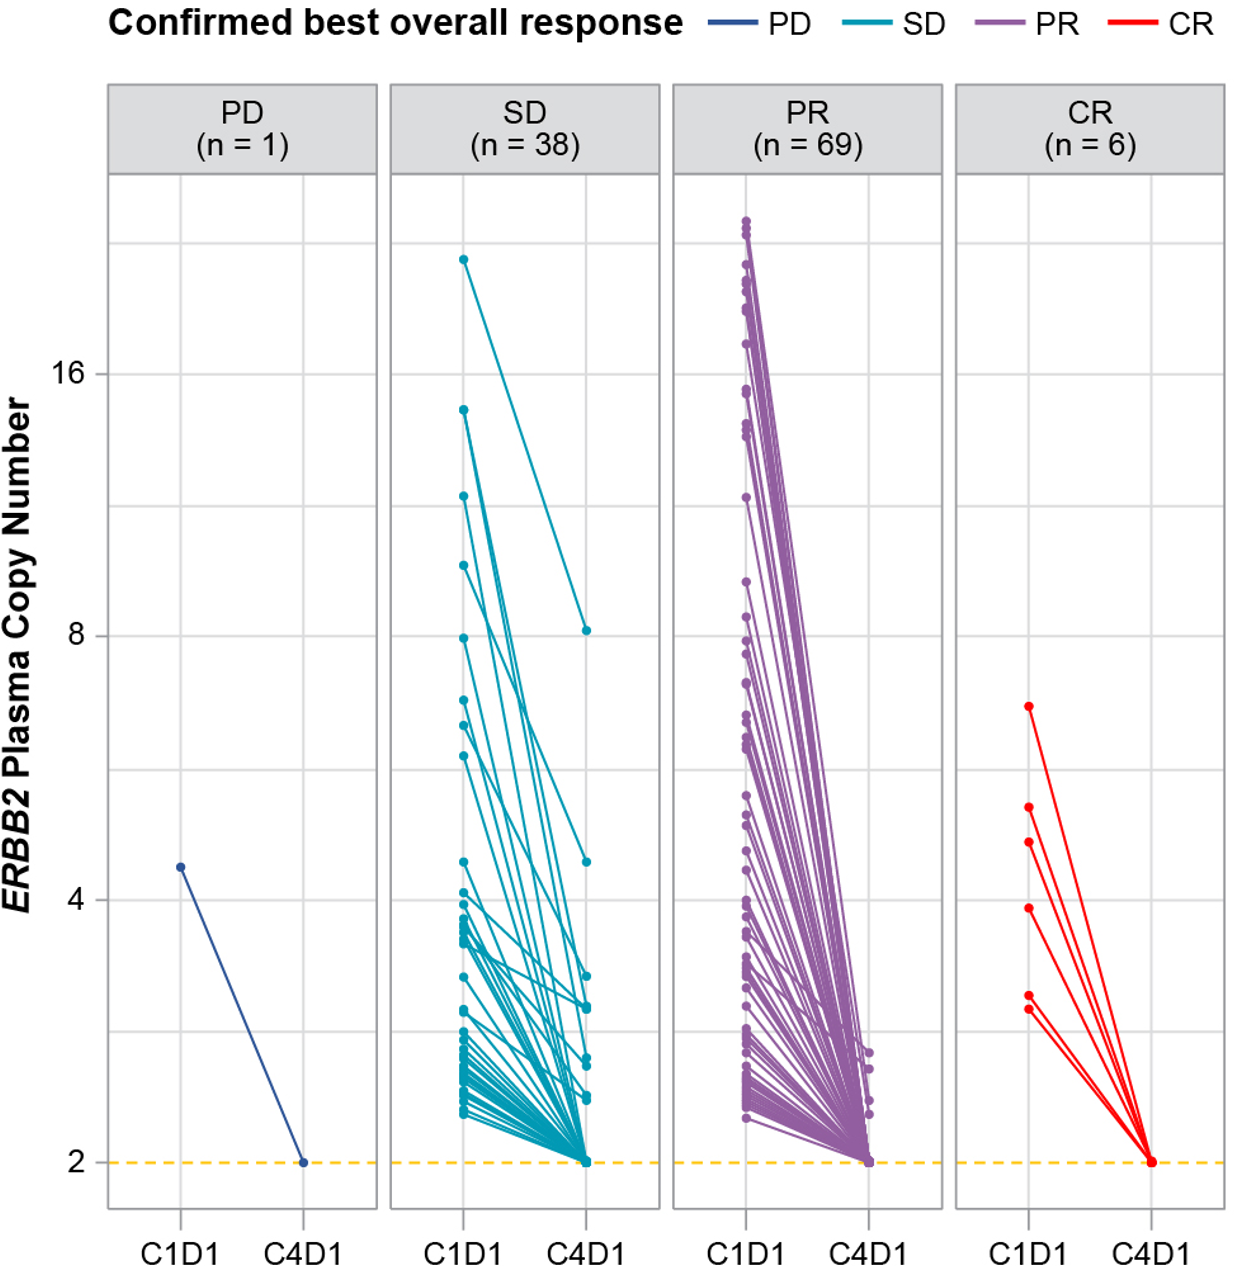
- ERBB2 pCN that was amplified at cycle 1, day 1 had decreased to nonamplified levels by cycle 4, day 1 in 88% of patients (100/114) who had available samples1
- Samples from almost all responders demonstrated a decrease to nonamplified levels1
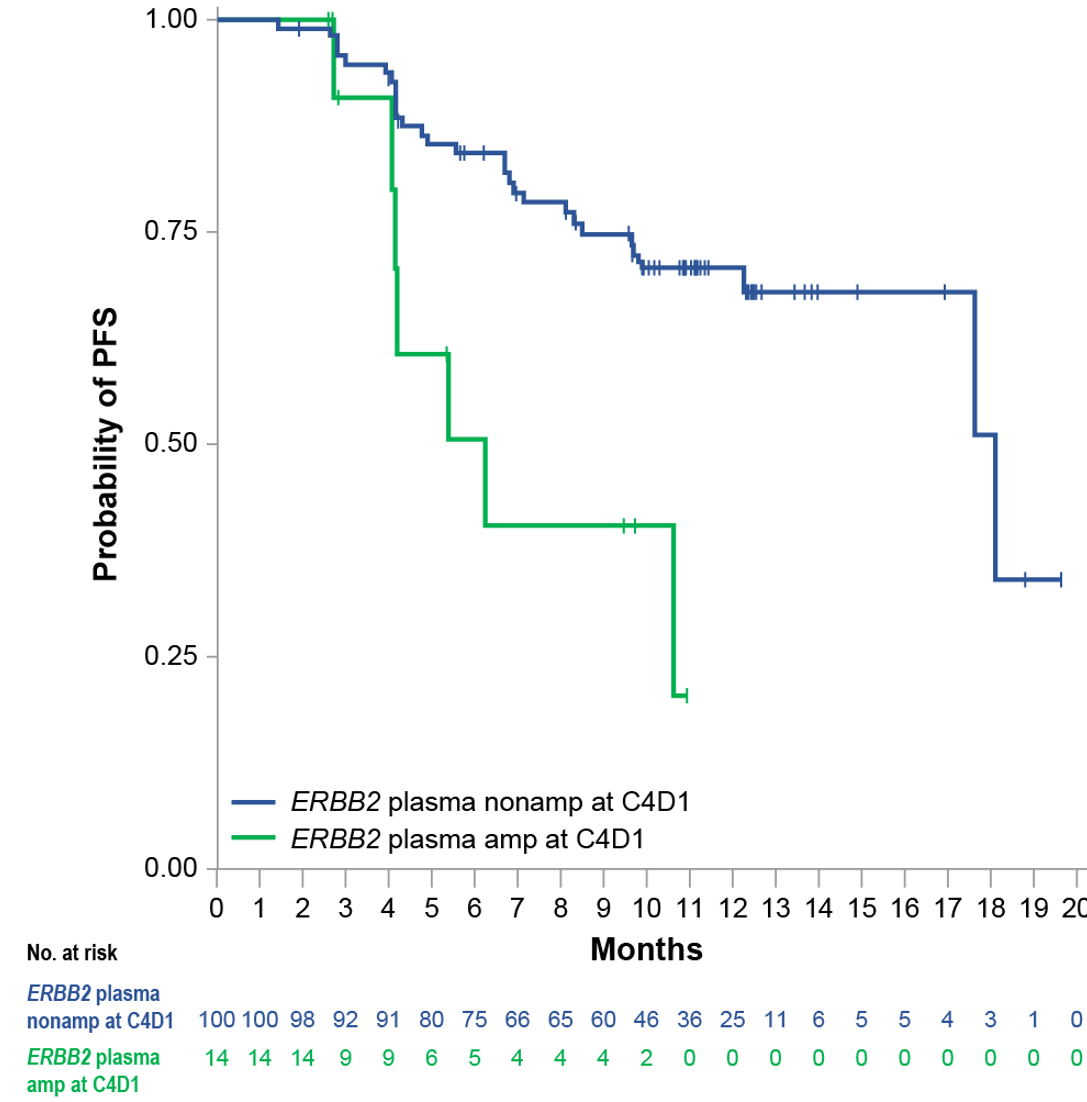
- Patients whose ERBB2 pCN dropped to nonamplified levels at cycle 4, day 1 had longer PFS1
- ERBB2 amplification status at cycle 4, day 1 predicted clinical outcomes
- In the multivariate analysis for PFS with HER2 IHC/ISH status, the covariate ERBB2 amplification status at cycle 4, day 1 remained significant (data not shown)
- Paired ctDNA data from 40 patients who discontinued T-DXd treatment due to disease progression were analyzed
- Oncogenic/likely oncogenic alterations were selected based on OncoKB2
- Acquired mutations were observed in several genes
ERBB2 Plasma Copy Number Over Time by Patient Response.1
ERBB2 Plasma Copy Number Over Time by Patient Response.1
PFS by ERBB2 Amplification Status at Cycle 4, Day 1.1
PFS by ERBB2 Amplification Status at Cycle 4, Day 1.1
| Covariate | Status | Patients, n | Median (95% CI) | HR (95% CI) | p Value | Response (CR/PR), n (%) | Odds Ratio (95% CI) | p Value |
PFS | ORR | |||||||
| ERBB2 amp at C4D1 | Nonamp | 100 | 18.1 (17.6–NE) | 3.55 | 0.00309 | 71 (71) | 6 | 0.00466 |
| Amp | 14 | 6.2 (4.1-NE) | (1.53–8.24) | 4 (28.6) | (1.8-22) | |||
ERBB2 pCN values less than the threshold of amplification determined by Guardant Health were represented by a value of 2.
Biomarkers Over Time: Gene Alteration1
- Paired ctDNA data from 40 patients who discontinued T-DXd treatment due to disease progression were analyzed
- Oncogenic/likely oncogenic alterations were selected based on OncoKB1
- Acquired mutations were observed in several genes1
| Gene | Patients, n | Mutation |
| TP53 | 3 | C275Y, R248W, E271K, N239_C242del |
| BRCA1 | 2 | D695fs, 1641_K652del, P674fs, N665fs, E1849 |
| ARID1A | 1 | H688fs |
| ATM | 1 | Q1015 |
| EPHA3 | 1 | 1486fs |
| KDM5C | 1 | R198 |
| MED12 | 1 | R1549fs |
| NFE2L2 | 1 | E79K |
| NOTCH4 | 1 | C744 |
| POLE | 1 | L424V |
| PTEN | 1 | Q214 |
| TOP1 | 1 | M644_M645del |
Mutational Landscape in Patients With Progression of Disease.1
Mutational Landscape in Patients With Progression of Disease.1
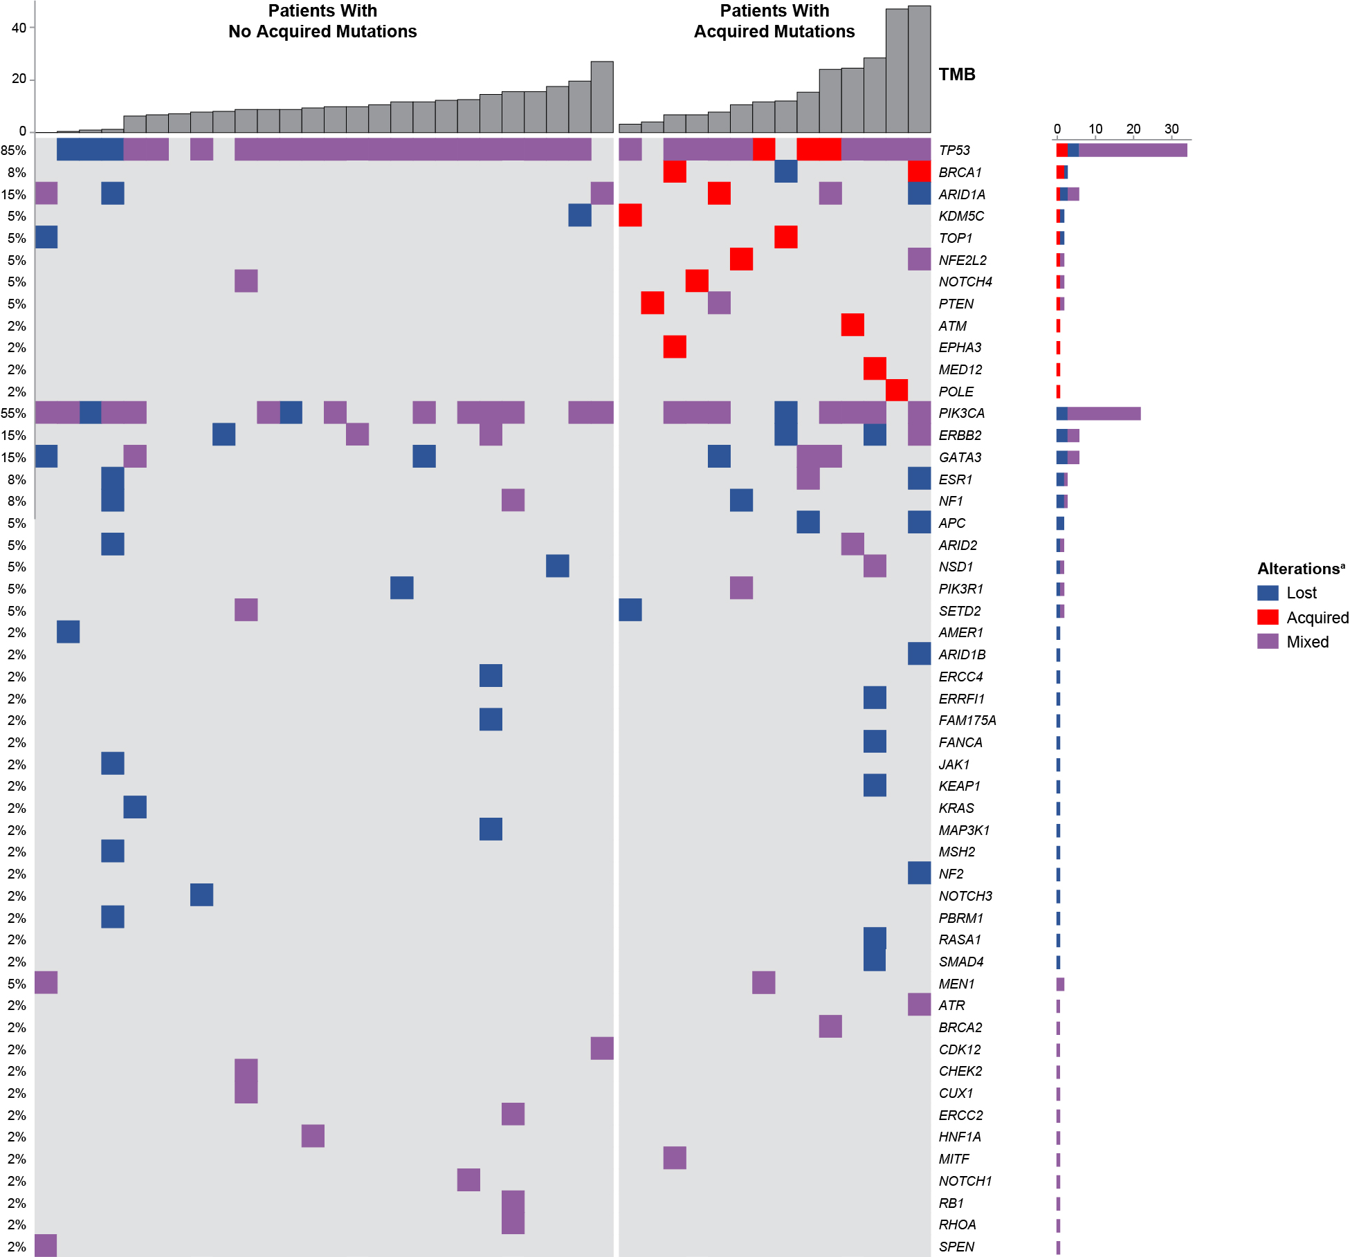
Acquired: a mutation detected only at disease progression; lose: a mutation detected only at cycle 1, day 1 (C1D1); mixed: different/the same variants in the same gene at C1D1 and at disease progression.
Abbreviations
Amp = amplification
;apCN = adjusted plasma copy number
;CR = complete response
;ctDNA = circulating tumor DNA
;DCO = data cut-off
;DNA = deoxyribonucleic acid
;ECD = extracellular domain
;FDR = false discovery rate
;GOF = gain-of-function
;HER2 = human epidermal growth factor receptor 2
;HR = hazard ratio
;IHC = immunohistochemistry
;ISH = in situ hybridization
;mut = mutation
;nonamp = nonamplified
;ORR = objective response rate
;PD = progressive disease
;PFS = progression-free survival
;PR = partial response
;RNA = ribonucleic acid
;SD = stable disease
;SNV = single nucleotide variant
;T-DXd = trastuzumab deruxtecan
References
2. Chakravarty D, Gao J, Philips SM, et al. OncoKB: A Precision Oncology Knowledge Base. JCO Precis Oncol. 2017;1:PO.17.00011.
Please note that this content may contain some data and/or patient populations which are considered off-label in your country. Providing this information does not constitute any recommendation for use. AstraZeneca is providing this material as an information service and professional courtesy.
To help us improve our content for health care professionals, please take this short survey.

©2023 AstraZeneca. All rights reserved.